
The Setup: How We Got Here
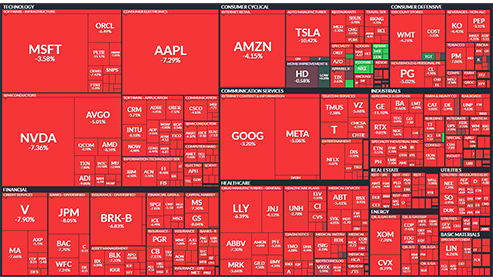
Markets have been on a strong run in recent months, but today’s selloff raises concerns about whether the rally is losing steam. The Dow Jones Industrial Average plummeted over 500 points (-1.2%), the S&P 500 dropped 1.8%, and the Nasdaq suffered the most, shedding 2.4% under pressure from struggling tech stocks. Investors are facing a cocktail of risks: renewed tariff tensions, disappointing earnings forecasts, and broader economic uncertainties.
The Inflection Point: What Changed Today?
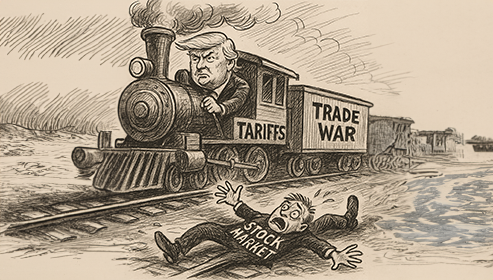
While some cracks were already visible in the market, today’s slide was catalyzed by a combination of policy-driven uncertainty and sector-specific struggles. The White House’s latest tariff announcements on Mexican and Canadian imports sparked fears of retaliatory trade measures, which could weigh on global supply chains. Meanwhile, the semiconductor industry—previously a market leader—saw heavy losses, with companies like Nvidia and Broadcom tumbling as investors reassess growth expectations.
Adding to the unease, earnings guidance from key tech firms suggests a cooling trend in consumer spending and corporate investment. After months of rallying on AI-driven euphoria, the Nasdaq is now showing signs of fatigue.
The Players: Who’s Winning, Who’s Losing?
-
Biggest Losers: Technology stocks were hit hardest, with chipmakers leading the decline. Nvidia and Broadcom saw steep drops as investors took profits following a red-hot 2024. Consumer cyclicals and financials also lagged, reflecting concerns over economic resilience.
-
Holding Ground: Energy stocks showed relative strength, as oil prices remained firm. Defensive sectors like utilities and consumer staples fared better than the broader market, indicating a shift toward risk-off positioning.
The Crossroads: Where Do We Go From Here?
Is this a short-term shakeout or the start of something bigger? While today’s drop alone isn’t enough to declare a full-blown reversal, it does suggest a market in need of consolidation. The S&P 500 is teetering around its 200-day moving average of 5,731, which analysts deem crucial for assessing long-term market trends. If trade tensions escalate further, or if earnings disappoint more broadly, volatility could remain elevated. The key levels to watch include the S&P 500’s support at 5,700 and the Nasdaq’s trendline near 18,000. A break below these could signal deeper downside.
The Trader’s Take
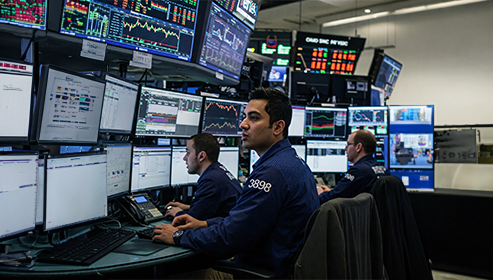
The macro picture is shifting, and traders should be prepared for increased turbulence. This doesn’t mean panic—but it does mean reassessing risk. If you’re a long-term investor, this could be an opportunity to pick up quality stocks at a discount, but caution is warranted. For traders, volatility strategies—such as selling high-IV spreads or positioning for potential rebounds in oversold sectors—may be the best way to navigate the coming weeks. The market is sending a message: Stay alert, because smooth sailing is over for now.
NVDA AVGO